Read any spatial omics and transfer from other tools
Here is the list of input you need to prepare:
count matrix
spatial location
image path (optional)
First, the count matrix should be an Pandas Dataframe with columns as gene names and rows as barcodes
[1]:
count_matrix
[1]:
| gene | 0610009B22Rik | 1110004F10Rik | 1110008P14Rik | 1110032A03Rik | 1110051M20Rik | 1110059G10Rik | 1110065P20Rik | 1500009C09Rik | 1500011B03Rik | 1500015O10Rik | ... | mt-Tc | mt-Tf | mt-Ti | mt-Tl1 | mt-Tl2 | mt-Tm | mt-Tp | mt-Tq | mt-Ts2 | mt-Tv |
|---|---|---|---|---|---|---|---|---|---|---|---|---|---|---|---|---|---|---|---|---|---|
| index | |||||||||||||||||||||
| c1 | 0 | 0 | 0 | 1 | 0 | 0 | 0 | 0 | 0 | 0 | ... | 0 | 0 | 0 | 0 | 0 | 0 | 0 | 0 | 0 | 0 |
| c2 | 0 | 0 | 1 | 0 | 0 | 0 | 0 | 0 | 0 | 0 | ... | 0 | 0 | 0 | 0 | 0 | 0 | 0 | 0 | 0 | 1 |
| c3 | 0 | 0 | 0 | 0 | 0 | 0 | 0 | 0 | 0 | 0 | ... | 0 | 0 | 0 | 0 | 0 | 0 | 0 | 0 | 0 | 0 |
| c4 | 0 | 0 | 0 | 0 | 0 | 0 | 0 | 0 | 0 | 0 | ... | 0 | 0 | 0 | 0 | 0 | 0 | 0 | 0 | 0 | 0 |
| c5 | 0 | 0 | 0 | 0 | 0 | 0 | 0 | 0 | 0 | 0 | ... | 0 | 0 | 0 | 0 | 0 | 0 | 0 | 0 | 0 | 0 |
| ... | ... | ... | ... | ... | ... | ... | ... | ... | ... | ... | ... | ... | ... | ... | ... | ... | ... | ... | ... | ... | ... |
| c12278 | 0 | 0 | 0 | 1 | 0 | 0 | 0 | 0 | 0 | 0 | ... | 0 | 0 | 0 | 0 | 0 | 0 | 0 | 0 | 0 | 0 |
| c12279 | 0 | 0 | 0 | 0 | 0 | 0 | 0 | 0 | 0 | 0 | ... | 0 | 0 | 0 | 0 | 0 | 0 | 0 | 0 | 0 | 0 |
| c12280 | 0 | 0 | 0 | 0 | 0 | 0 | 0 | 0 | 0 | 0 | ... | 0 | 0 | 0 | 0 | 0 | 1 | 0 | 0 | 0 | 0 |
| c12281 | 0 | 0 | 0 | 0 | 0 | 0 | 0 | 0 | 0 | 0 | ... | 0 | 0 | 0 | 0 | 0 | 0 | 0 | 0 | 0 | 0 |
| c12282 | 0 | 0 | 1 | 0 | 0 | 0 | 0 | 0 | 0 | 0 | ... | 0 | 0 | 0 | 0 | 0 | 0 | 0 | 0 | 0 | 0 |
12282 rows × 3235 columns
The spatial information of the data should also be a Pandas Dataframe with two columns imagecol (X) and imagerow (Y).
[2]:
spatial
[2]:
| imagecol | imagerow | |
|---|---|---|
| 0 | 2242.482759 | 1349.896552 |
| 1 | 1707.537313 | 3820.507463 |
| 2 | 1166.068421 | 4450.200000 |
| 3 | 4281.867925 | 4462.679245 |
| 4 | 1462.616000 | 2813.248000 |
| ... | ... | ... |
| 12277 | 2395.422018 | 5990.504587 |
| 12278 | 2623.265060 | 4220.325301 |
| 12279 | 1808.611111 | 4375.761111 |
| 12280 | 2336.065693 | 5332.613139 |
| 12281 | 1124.329341 | 4428.023952 |
12282 rows × 2 columns
The image path is optional. If you don’t provide any image, the background will be 'black' or 'white'.
Create the object for stLearn
[3]:
import stlearn as st
adata = st.create_stlearn(count=count_matrix,spatial=spatial,library_id="Sample_test", scale=1,background_color="white")
[4]:
adata
[4]:
AnnData object with n_obs × n_vars = 12282 × 3235
    obs: 'imagecol', 'imagerow'
    uns: 'spatial'
    obsm: 'spatial'
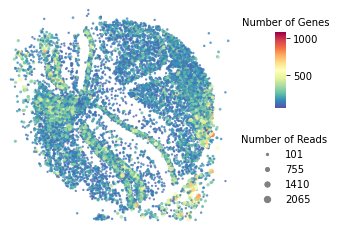
Quality control plot
[5]:
st.pl.QC_plot(adata)
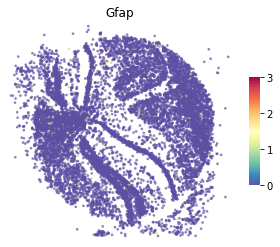
An example of gene plot
[6]:
st.pl.gene_plot(adata,gene_symbols="Gfap")
Add metadata
stLearn core object is using AnnData then you can transfer the clustering results to adata.obs. For example, you have clustering results from Seurat seurat_results (should be a numpy array), and then you can plot it with stlearn.pl.cluster_plot and use_label == "seurat" :
[7]:
adata.obs["seurat"] = pd.Categorical(seurat_results)