Working with Old Spatial Transcriptomics data
Preparation files
Use need to prepare 3 files: count_matrix_file, spatial_file and image_file
The file should follow this format:
[1]:
import pandas as pd
Format for the count_matrix_file
[2]:
pd.read_table("../../../UQ/Developmental_heart/ST_Samples_4.5-5PCW/ST_Sample_4.5-5PCW_1/ST_Sample_4.5-5.tsv",index_col=0).head()
[2]:
| ENSG00000000003.14 | ENSG00000000005.5 | ENSG00000000419.12 | ENSG00000000457.13 | ENSG00000000460.16 | ENSG00000000938.12 | ENSG00000000971.15 | ENSG00000001036.13 | ENSG00000001084.10 | ENSG00000001167.14 | ... | ENSG00000283667.1 | ENSG00000283669.1 | ENSG00000283674.1 | ENSG00000283675.1 | ENSG00000283683.1 | ENSG00000283684.1 | ENSG00000283689.1 | ENSG00000283692.1 | ENSG00000283696.1 | ENSG00000283698.1 | |
|---|---|---|---|---|---|---|---|---|---|---|---|---|---|---|---|---|---|---|---|---|---|
| 17x20 | 0 | 0 | 0 | 0 | 0 | 0 | 0 | 0 | 0 | 0 | ... | 0 | 0 | 0 | 0 | 0 | 0 | 0 | 0 | 0 | 0 |
| 17x21 | 0 | 0 | 0 | 0 | 0 | 0 | 0 | 0 | 0 | 0 | ... | 0 | 0 | 0 | 0 | 0 | 0 | 0 | 0 | 0 | 0 |
| 17x22 | 0 | 0 | 0 | 0 | 0 | 0 | 0 | 0 | 0 | 0 | ... | 0 | 0 | 0 | 0 | 0 | 0 | 0 | 0 | 0 | 0 |
| 18x18 | 0 | 0 | 0 | 0 | 0 | 0 | 0 | 0 | 0 | 0 | ... | 0 | 0 | 0 | 0 | 0 | 0 | 0 | 0 | 0 | 0 |
| 18x19 | 0 | 0 | 0 | 0 | 0 | 0 | 0 | 0 | 0 | 0 | ... | 0 | 0 | 0 | 0 | 0 | 0 | 0 | 0 | 0 | 0 |
5 rows × 39739 columns
Format for the spatial_file (column selected is optional). It should have the x and y column match the column in count_matrix_file. The pixel_x and pixel_y columns should be match with the image_file.
[3]:
pd.read_table("../../../UQ/Developmental_heart/ST_Samples_4.5-5PCW/ST_Sample_4.5-5PCW_1/spot_data-all-ST_Sample_4.5-5PCW_1.tsv")
[3]:
| x | y | new_x | new_y | pixel_x | pixel_y | selected | |
|---|---|---|---|---|---|---|---|
| 0 | 1 | 1 | 0.96 | 1.03 | 1787.5 | 522.3 | 0 |
| 1 | 1 | 2 | 0.99 | 2.03 | 1795.7 | 741.1 | 0 |
| 2 | 1 | 3 | 0.94 | 3.09 | 1783.2 | 972.1 | 0 |
| 3 | 1 | 4 | 0.97 | 4.04 | 1790.8 | 1181.2 | 0 |
| 4 | 1 | 5 | 0.99 | 5.02 | 1794.1 | 1395.5 | 0 |
| ... | ... | ... | ... | ... | ... | ... | ... |
| 1132 | 33 | 31 | 33.02 | 30.93 | 8732.3 | 7059.4 | 0 |
| 1133 | 33 | 32 | 33.01 | 31.89 | 8730.2 | 7269.5 | 0 |
| 1134 | 33 | 33 | 33.03 | 32.91 | 8734.7 | 7492.1 | 0 |
| 1135 | 33 | 34 | 33.02 | 33.95 | 8731.8 | 7721.1 | 0 |
| 1136 | 33 | 35 | 33.01 | 34.93 | 8731.0 | 7934.6 | 0 |
1137 rows × 7 columns
Read the old ST-seq dataset
[1]:
import stlearn as st
[2]:
data = st.ReadOldST(count_matrix_file="[PATH to count_matrix_file file]",
                    spatial_file="[PATH to spatial_file file]",
                    image_file="[PATH to image_file file]")
Added tissue image to the object!
[3]:
data
[3]:
AnnData object with n_obs × n_vars = 676 × 26907
    obs: 'imagecol', 'imagerow'
    uns: 'spatial'
    obsm: 'spatial'
[4]:
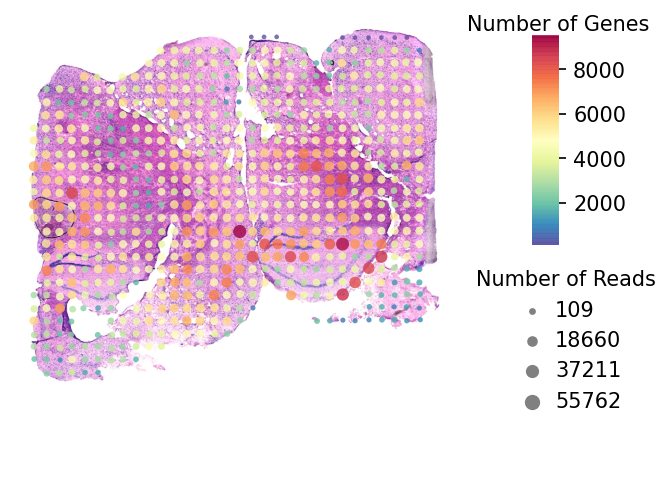
st.pl.QC_plot(data,dpi=150)
Run preprocessing for count data
[5]:
st.pp.filter_genes(data,min_cells=3)
st.pp.normalize_total(data)
st.pp.log1p(data)
st.pp.scale(data)
Normalization step is finished in adata.X
Log transformation step is finished in adata.X
Scale step is finished in adata.X
Run PCA
[6]:
st.em.run_pca(data,n_comps=50,random_state=0)
PCA is done! Generated in adata.obsm['X_pca'], adata.uns['pca'] and adata.varm['PCs']
Create k-nearest-neigbor graph
[7]:
st.pp.neighbors(data,n_neighbors=30,use_rep='X_pca',random_state=0)
Created k-Nearest-Neighbor graph in adata.uns['neighbors']
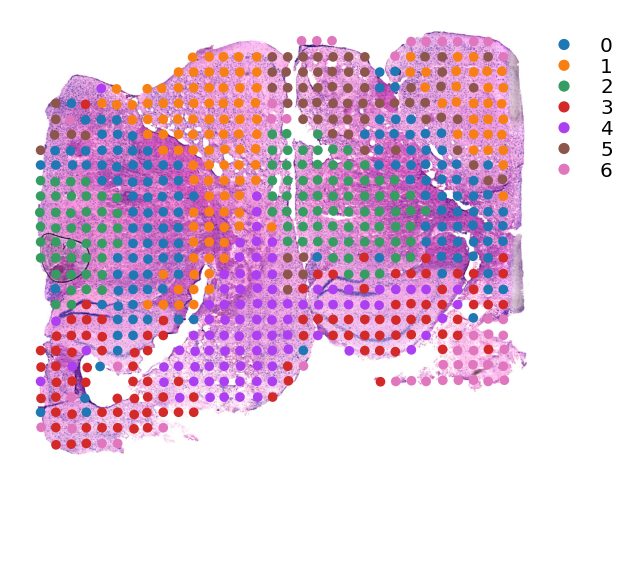
Run and plot louvain clustering
[8]:
st.tl.clustering.louvain(data,random_state=0)
Applying Louvain clustering ...
Louvain clustering is done! The labels are stored in adata.obs['louvain']
[9]:
st.pl.cluster_plot(data,use_label="louvain",tissue_alpha=1,spot_size=15,show_legend=True)
Run and plot k-means clustering
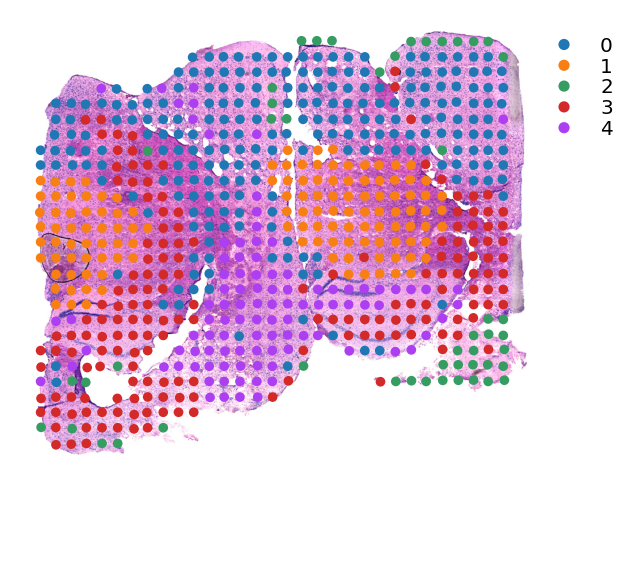
[10]:
st.tl.clustering.kmeans(data,n_clusters=5)
Applying Kmeans clustering ...
Kmeans clustering is done! The labels are stored in adata.obs["kmeans"]
[11]:
st.pl.cluster_plot(data,use_label="kmeans",tissue_alpha=1,spot_size=15,show_legend=True)