stSME normalization & imputation effects
This tutorial shows the stSME normalization effect between of two scenarios: - (1) normal (without stSME) - (2) stSME applied on raw gene counts
In this tutorial we use Mouse Brain (Coronal) Visium dataset from 10x genomics website.
[1]:
# import module
import stlearn as st
from pathlib import Path
st.settings.set_figure_params(dpi=180)
[2]:
# specify PATH to data
BASE_PATH = Path("/home/uqysun19/60days/10x_visium/mouse_brain_coronal")

# spot tile is the intermediate result of image pre-processing
TILE_PATH = Path("/tmp/tiles")
TILE_PATH.mkdir(parents=True, exist_ok=True)

# output path
OUT_PATH = Path("/home/uqysun19/60days/stlearn_plot/mouse_brain_coronl")
OUT_PATH.mkdir(parents=True, exist_ok=True)
[3]:
# load data
data = st.Read10X(BASE_PATH)
Variable names are not unique. To make them unique, call `.var_names_make_unique`.
Variable names are not unique. To make them unique, call `.var_names_make_unique`.
[4]:
# pre-processing for gene count table
st.pp.filter_genes(data,min_cells=1)
st.pp.normalize_total(data)
st.pp.log1p(data)
Normalization step is finished in adata.X
Log transformation step is finished in adata.X
[5]:
# pre-processing for spot image
st.pp.tiling(data, TILE_PATH)

# this step uses deep learning model to extract high-level features from tile images
# may need few minutes to be completed
st.pp.extract_feature(data)
Tiling image: 100%|██████████ [ time left: 00:00 ]
Extract feature: 100%|██████████ [ time left: 00:00 ]
The morphology feature is added to adata.obsm['X_morphology']!
[6]:
# run PCA for gene expression data
st.em.run_pca(data,n_comps=50)
PCA is done! Generated in adata.obsm['X_pca'], adata.uns['pca'] and adata.varm['PCs']
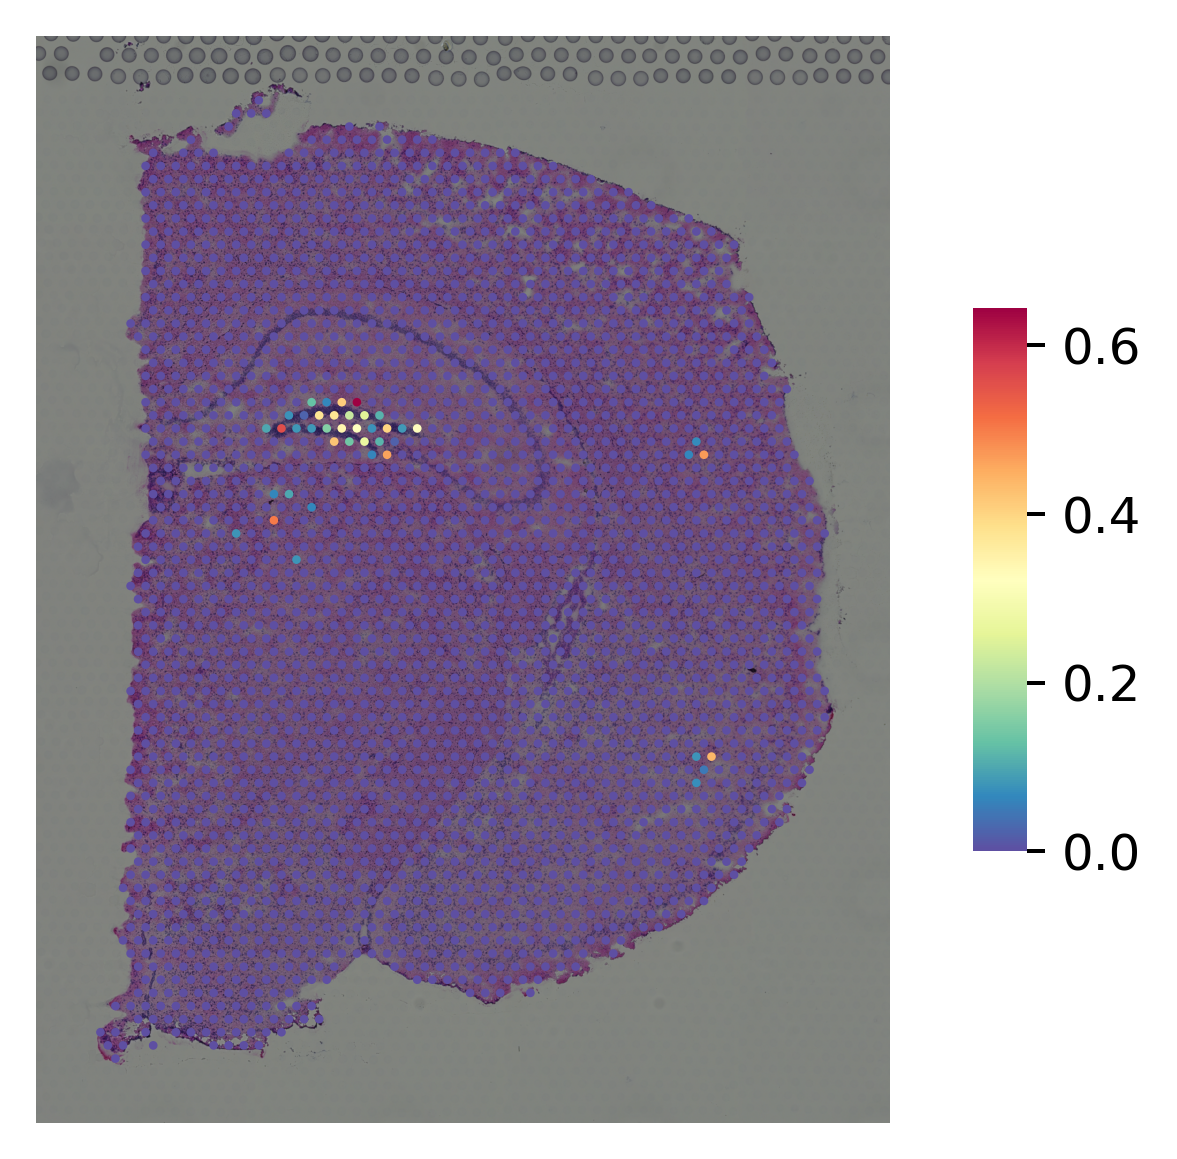
(1) normal (without stSME)
[7]:
data_normal = data.copy()
marker gene for CA3
[8]:
i="Lhfpl1"
st.pl.gene_plot(data_normal, gene_symbols=i, size=3,
                    fname=str(OUT_PATH) + "/without_SME_{}".format(str(i)) + ".png")
/home/uqysun19/90days/.conda/envs/stlearn/lib/python3.8/site-packages/stlearn/plotting/gene_plot.py:140: MatplotlibDeprecationWarning: The 'cmap' parameter to Colorbar has no effect because it is overridden by the mappable; it is deprecated since 3.3 and will be removed two minor releases later.
  cb = plt.colorbar(plot, aspect=10, shrink=0.5, cmap=cmap)
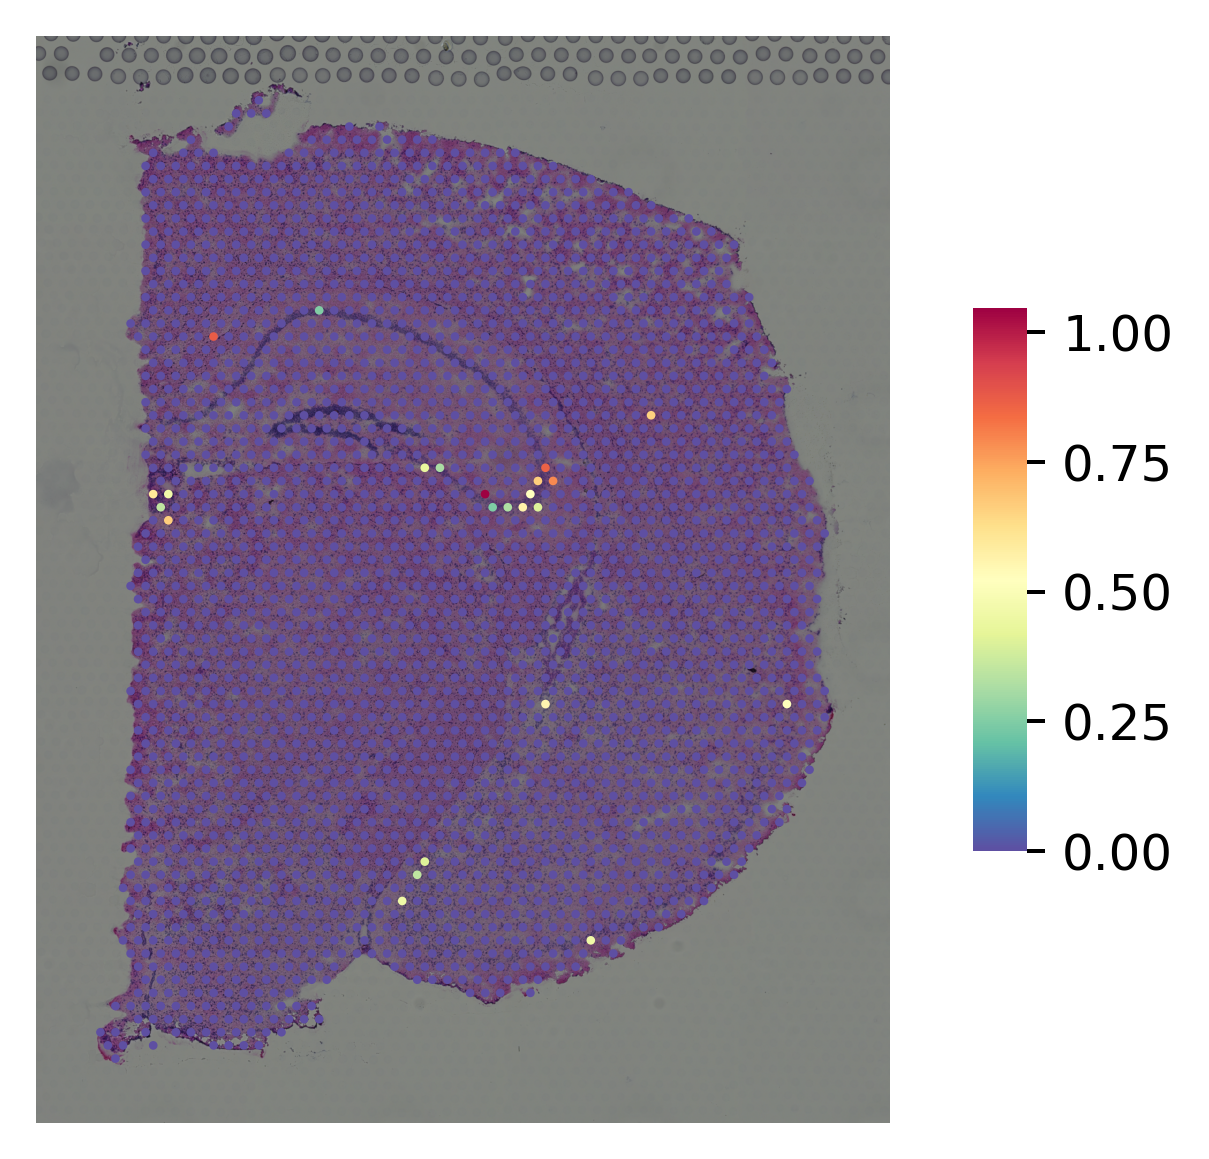
marker gene for DG
[9]:
i="Pla2g2f"
st.pl.gene_plot(data_normal, gene_symbols=i, size=3,
                    fname=str(OUT_PATH) + "/without_SME_{}".format(str(i)) + ".png")
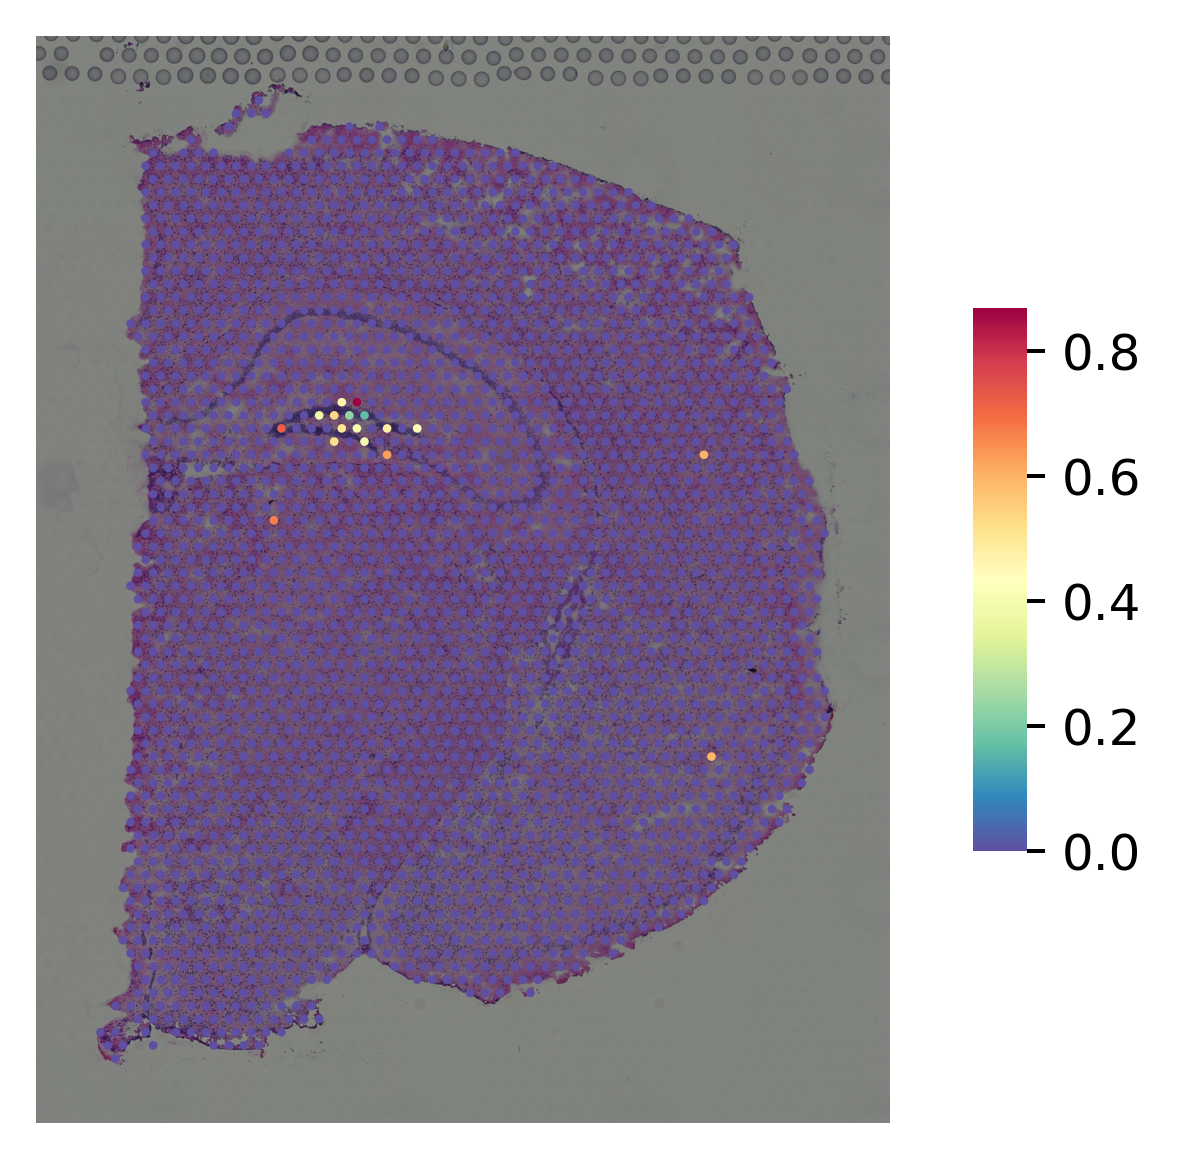
(2) stSME applied on raw gene counts
[10]:
data_SME = data.copy()
# apply stSME to normalise log transformed data
st.spatial.SME.SME_normalize(data_SME, use_data="raw")
data_SME.X = data_SME.obsm['raw_SME_normalized']
st.em.run_pca(data_SME,n_comps=50)
Adjusting data: 100%|██████████ [ time left: 00:00 ]
The data adjusted by SME is added to adata.obsm['raw_SME_normalized']
PCA is done! Generated in adata.obsm['X_pca'], adata.uns['pca'] and adata.varm['PCs']
marker gene for CA3
[11]:
i="Lhfpl1"
st.pl.gene_plot(data_SME, gene_symbols=i, size=3,
                    fname=str(OUT_PATH) + "/without_SME_{}".format(str(i)) + ".png")
/home/uqysun19/90days/.conda/envs/stlearn/lib/python3.8/site-packages/stlearn/plotting/gene_plot.py:140: MatplotlibDeprecationWarning: The 'cmap' parameter to Colorbar has no effect because it is overridden by the mappable; it is deprecated since 3.3 and will be removed two minor releases later.
  cb = plt.colorbar(plot, aspect=10, shrink=0.5, cmap=cmap)
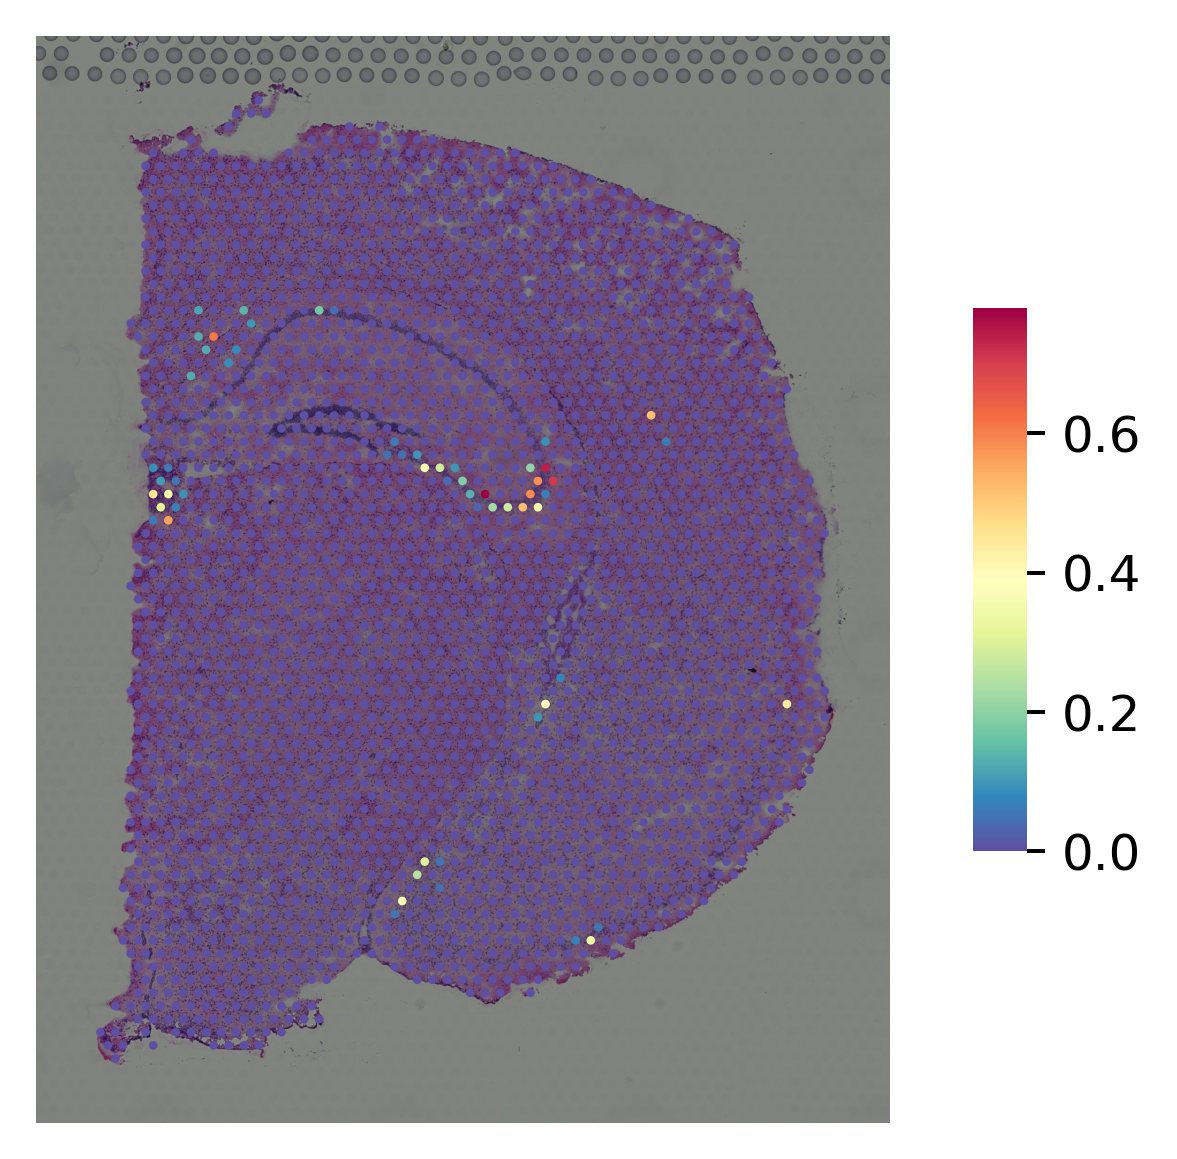
marker gene for DG
[12]:
i="Pla2g2f"
st.pl.gene_plot(data_SME, gene_symbols=i, size=3,
                    fname=str(OUT_PATH) + "/without_SME_{}".format(str(i)) + ".png")