Integrating Multiple Datasets
In this tutorial, we will integrate two related samples together.
[1]:
import os
import platform

# Only constrain threads on macOS where BLAS/numba deadlocks are common.
# Must run before any numpy/scanpy import.
if platform.system() == "Darwin":
    os.environ["OPENBLAS_NUM_THREADS"] = "1"
    os.environ["MKL_NUM_THREADS"] = "1"
    os.environ["NUMBA_NUM_THREADS"] = "1"
    n_cpus = 1
else:
    n_cpus = None
[2]:
import anndata as ad
import stlearn as st
import scanpy as sc
import harmonypy as hm
import pathlib as pathlib
import numpy as np
import random as random
import os as os

st.settings.set_figure_params(dpi=120)

# Make sure all the seeds are set
seed = 0
np.random.seed(seed)
random.seed(seed)
os.environ['PYTHONHASHSEED'] = str(seed)
Read data
In this tutorial, we are using the Breast cancer datasets with 2 sections of block A.
Source:
https://www.10xgenomics.com/datasets/human-breast-cancer-block-a-section-1-1-standard-1-1-0 and
https://www.10xgenomics.com/datasets/human-breast-cancer-block-a-section-2-1-standard-1-1-0
[3]:
st.settings.datasetdir = pathlib.Path.cwd().parent / "data"
[4]:
block1 = sc.datasets.visium_sge(sample_id="V1_Breast_Cancer_Block_A_Section_1")
block1 = st.convert_scanpy(block1)
/var/folders/j9/xg__c_rx4jdgzs2r1dqd43hr0000gn/T/ipykernel_2342/3373623502.py:1: FutureWarning: Use `squidpy.datasets.visium` instead.
  block1 = sc.datasets.visium_sge(sample_id="V1_Breast_Cancer_Block_A_Section_1")
/Users/andrew/conda/stlearn/lib/python3.12/site-packages/anndata/_core/anndata.py:1880: UserWarning: Variable names are not unique. To make them unique, call `.var_names_make_unique`.
  utils.warn_names_duplicates("var")
[5]:
block2 = sc.datasets.visium_sge(sample_id="V1_Breast_Cancer_Block_A_Section_2")
block2 = st.convert_scanpy(block2)
/var/folders/j9/xg__c_rx4jdgzs2r1dqd43hr0000gn/T/ipykernel_2342/1770333052.py:1: FutureWarning: Use `squidpy.datasets.visium` instead.
  block2 = sc.datasets.visium_sge(sample_id="V1_Breast_Cancer_Block_A_Section_2")
/Users/andrew/conda/stlearn/lib/python3.12/site-packages/anndata/_core/anndata.py:1880: UserWarning: Variable names are not unique. To make them unique, call `.var_names_make_unique`.
  utils.warn_names_duplicates("var")
Processing data
[6]:
# concatenate 2 samples
adata_concat = ad.concat(
    [block1, block2],
    label="batch",
    join="inner",
    index_unique="-",
    uns_merge="unique"
)
[7]:
# Preprocessing
# Filter genes
sc.pp.filter_genes(adata_concat, min_cells=3)
# Normalize data
sc.pp.normalize_total(adata_concat, target_sum=1e4)
# Log transformation
sc.pp.log1p(adata_concat)
# Store raw data
adata_concat.raw = adata_concat
# Extract top highly variable genes
sc.pp.highly_variable_genes(adata_concat, min_mean=0.0125, max_mean=3, min_disp=0.5)
adata_concat = adata_concat[:, adata_concat.var.highly_variable]
# Scale data
sc.pp.scale(adata_concat, max_value=10)
/Users/andrew/conda/stlearn/lib/python3.12/functools.py:912: UserWarning: Received a view of an AnnData. Making a copy.
  return dispatch(args[0].__class__)(*args, **kw)
/Users/andrew/conda/stlearn/lib/python3.12/functools.py:912: UserWarning: zero-centering a sparse array/matrix densifies it.
  return dispatch(args[0].__class__)(*args, **kw)
[8]:
# Run dimensionality reduction
sc.pp.pca(adata_concat, n_comps=30, svd_solver='arpack')
Run integration with harmony
[9]:
# Prepare metadata and PCA
meta_data = adata_concat.obs
data_mat = adata_concat.obsm["X_pca"]
[10]:
# Run harmony
ho = hm.run_harmony(data_mat, meta_data, "batch")
2026-05-05 12:56:38,004 - harmonypy - INFO - Running Harmony (PyTorch on mps)
2026-05-05 12:56:38,005 - harmonypy - INFO -   Parameters:
2026-05-05 12:56:38,005 - harmonypy - INFO -     max_iter_harmony: 10
2026-05-05 12:56:38,005 - harmonypy - INFO -     max_iter_kmeans: 20
2026-05-05 12:56:38,005 - harmonypy - INFO -     epsilon_cluster: 1e-05
2026-05-05 12:56:38,005 - harmonypy - INFO -     epsilon_harmony: 0.0001
2026-05-05 12:56:38,005 - harmonypy - INFO -     nclust: 100
2026-05-05 12:56:38,005 - harmonypy - INFO -     block_size: 0.05
2026-05-05 12:56:38,006 - harmonypy - INFO -     lamb: [1. 1.]
2026-05-05 12:56:38,006 - harmonypy - INFO -     theta: [2. 2.]
2026-05-05 12:56:38,006 - harmonypy - INFO -     sigma: [0.1 0.1 0.1 0.1 0.1]...
2026-05-05 12:56:38,006 - harmonypy - INFO -     verbose: True
2026-05-05 12:56:38,006 - harmonypy - INFO -     random_state: 0
2026-05-05 12:56:38,006 - harmonypy - INFO -   Data: 30 PCs × 7785 cells
2026-05-05 12:56:38,006 - harmonypy - INFO -   Batch variables: ['batch']
2026-05-05 12:56:39,393 - harmonypy - INFO - Computing initial centroids with sklearn.KMeans...
2026-05-05 12:56:39,468 - harmonypy - INFO - KMeans initialization complete.
2026-05-05 12:56:40,035 - harmonypy - INFO - Iteration 1 of 10
2026-05-05 12:56:42,535 - harmonypy - INFO - Iteration 2 of 10
2026-05-05 12:56:42,710 - harmonypy - INFO - Iteration 3 of 10
2026-05-05 12:56:42,874 - harmonypy - INFO - Iteration 4 of 10
2026-05-05 12:56:43,054 - harmonypy - INFO - Iteration 5 of 10
2026-05-05 12:56:43,227 - harmonypy - INFO - Iteration 6 of 10
2026-05-05 12:56:43,338 - harmonypy - INFO - Iteration 7 of 10
2026-05-05 12:56:43,456 - harmonypy - INFO - Iteration 8 of 10
2026-05-05 12:56:43,565 - harmonypy - INFO - Converged after 8 iterations
[11]:
# Mapping back the result to the adata object
adata_concat.obsm["X_pca"] = ho.Z_corr
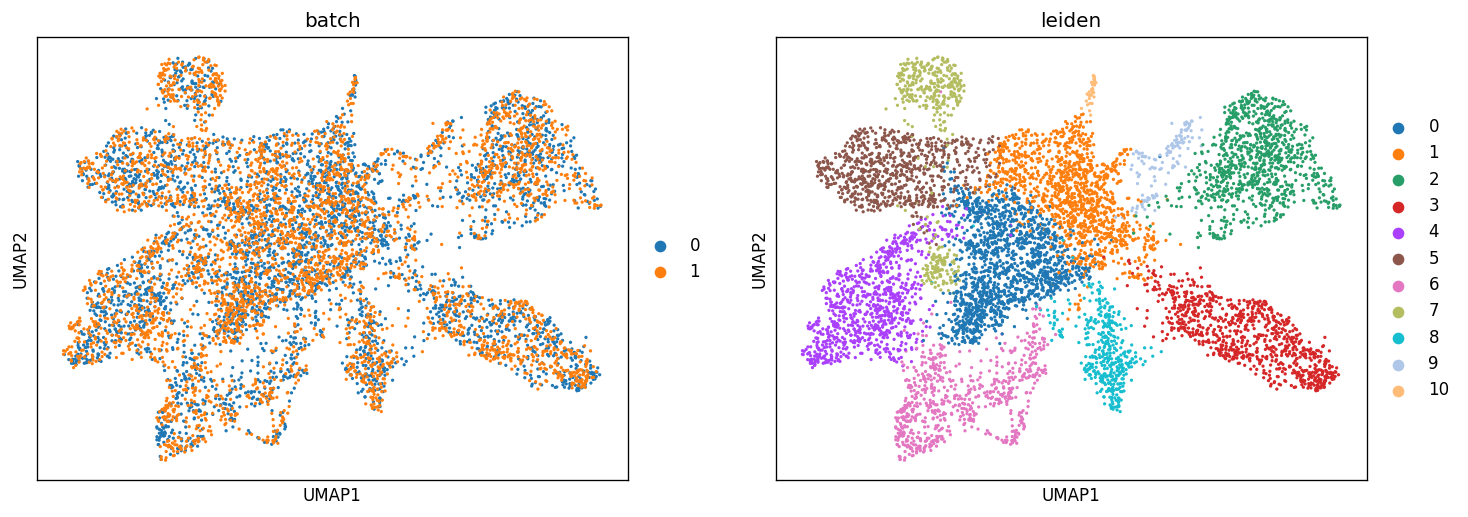
Perform clustering and visualize the results by UMAP
[12]:
# Build KNN and run UMAP
sc.pp.neighbors(adata_concat, n_pcs=30)
sc.tl.umap(adata_concat)
[13]:
# Run clustering with leiden
sc.tl.leiden(adata_concat, resolution=0.45)
/var/folders/j9/xg__c_rx4jdgzs2r1dqd43hr0000gn/T/ipykernel_2342/3820723612.py:2: FutureWarning: The `igraph` implementation of leiden clustering is *orders of magnitude faster*. Set the flavor argument to (and install if needed) 'igraph' to use it.
In the future, the default backend for leiden will be igraph instead of leidenalg. To achieve the future defaults please pass: `flavor='igraph'` and `n_iterations=2`. `directed` must also be `False` to work with igraph’s implementation.
  sc.tl.leiden(adata_concat, resolution=0.45)
[14]:
# Plotting UMAP
sc.pl.umap(adata_concat, color=["batch", "leiden"])
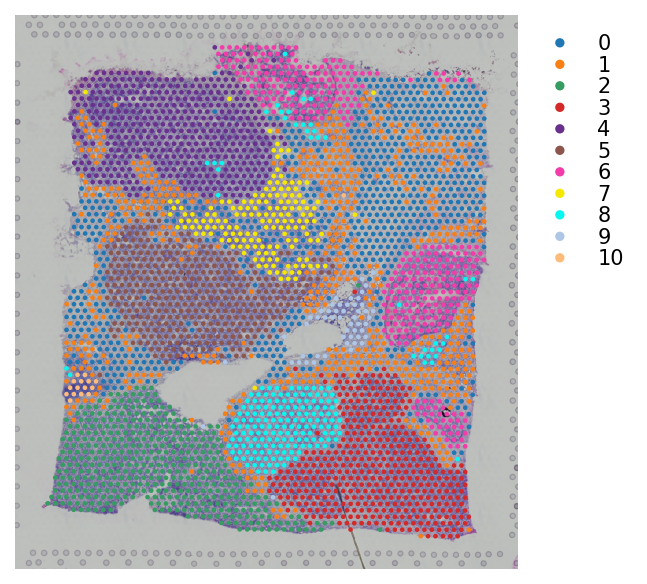
Map the result back to the original samples
[15]:
st.settings.set_figure_params(dpi=150)
# Map leiden clusteirng result to block A section 1
block1.obs["leiden"] = adata_concat.obs[adata_concat.obs.batch == "0"].leiden.values
[16]:
# Plotting the clusteirng result
st.pl.cluster_plot(block1, use_label="leiden", bbox_to_anchor=(1.25, 1))
[16]:
AnnData object with n_obs × n_vars = 3798 × 36601
    obs: 'in_tissue', 'array_row', 'array_col', 'imagecol', 'imagerow', 'leiden'
    var: 'gene_ids', 'feature_types', 'genome'
    uns: 'spatial', 'leiden_colors'
    obsm: 'spatial'
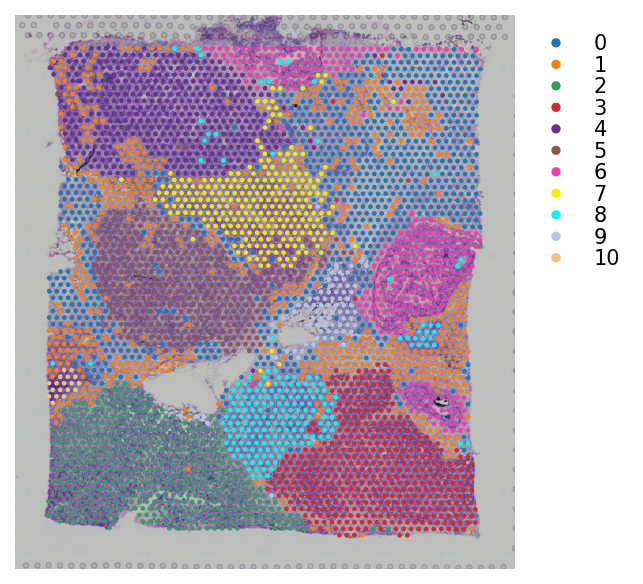
[17]:
# Map leiden clustering result to block A section 2
block2.obs["leiden"] = adata_concat.obs[adata_concat.obs.batch == "1"].leiden.values
[18]:
# Plotting the clustering result
st.pl.cluster_plot(block2, use_label="leiden", bbox_to_anchor=(1.25, 1))
[18]:
AnnData object with n_obs × n_vars = 3987 × 36601
    obs: 'in_tissue', 'array_row', 'array_col', 'imagecol', 'imagerow', 'leiden'
    var: 'gene_ids', 'feature_types', 'genome'
    uns: 'spatial', 'leiden_colors'
    obsm: 'spatial'
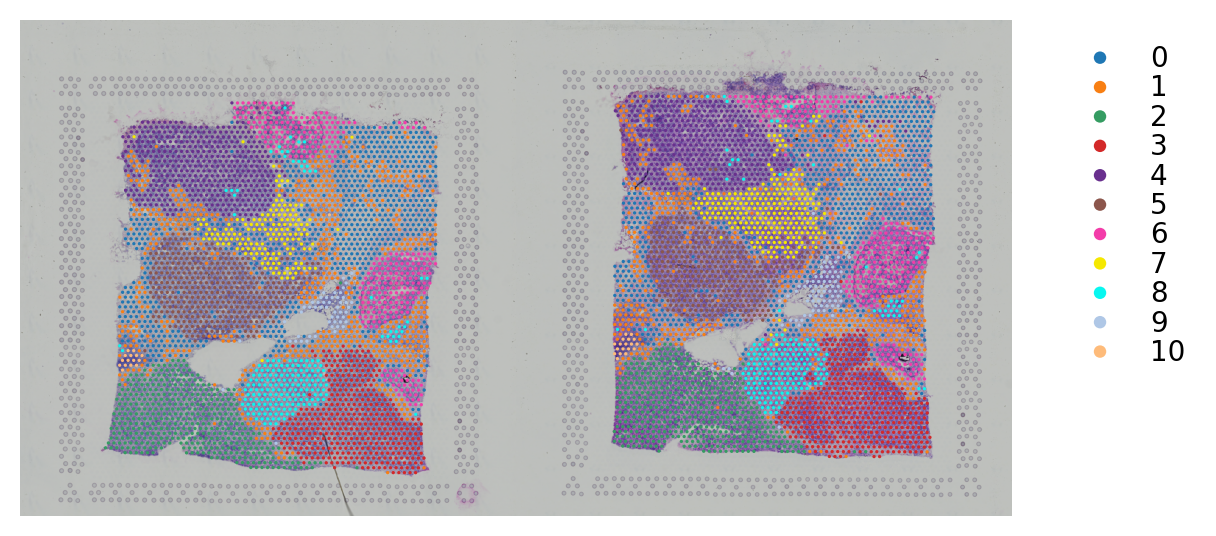
Manually combine the images and change the coordinates
This is a way to plotting 2 samples in the same adata object.
[19]:
# Initialize the spatial
adata_concat.uns["spatial"] = block1.uns["spatial"]
[20]:
# Horizontally stack 2 images from section 1 and section 2 datasets
combined = np.hstack([block1.uns["spatial"]["V1_Breast_Cancer_Block_A_Section_1"]["images"]["hires"],
                      block2.uns["spatial"]["V1_Breast_Cancer_Block_A_Section_2"]["images"]["hires"]])
[21]:
# Map the image to the concatnated adata object
adata_concat.uns["spatial"]["V1_Breast_Cancer_Block_A_Section_1"]["images"]["hires"] = combined
[22]:
# Manually change the coordinate of spots to the right
adata_concat.obs.loc[adata_concat.obs.batch == "1", "imagecol"] = adata_concat.obs.loc[
                                                                      adata_concat.obs.batch == "1", "imagecol"].values + 2000
[23]:
# Change to the .obsm["spatial"]
factor = adata_concat.uns["spatial"]["V1_Breast_Cancer_Block_A_Section_1"]["scalefactors"]["tissue_hires_scalef"]
adata_concat.obsm["spatial"] = adata_concat.obs[["imagecol", "imagerow"]].values / factor
[24]:
st.settings.set_figure_params(dpi=200)
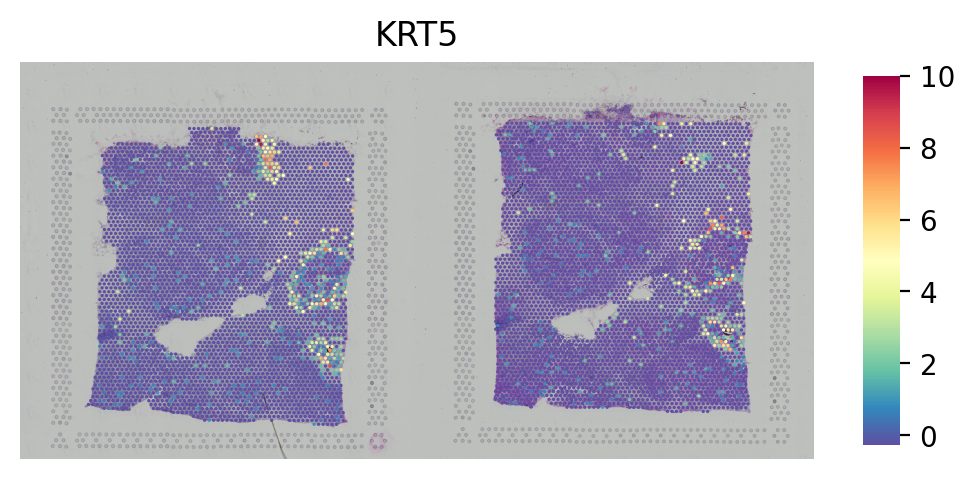
[25]:
# Plot the gene
st.pl.gene_plot(adata_concat, gene_symbols="KRT5", crop=False, size=1.4, cell_alpha=1)
[25]:
AnnData object with n_obs × n_vars = 7785 × 3018
    obs: 'in_tissue', 'array_row', 'array_col', 'imagecol', 'imagerow', 'batch', 'leiden'
    var: 'n_cells', 'highly_variable', 'means', 'dispersions', 'dispersions_norm', 'mean', 'std'
    uns: 'spatial', 'log1p', 'hvg', 'pca', 'neighbors', 'umap', 'leiden', 'batch_colors', 'leiden_colors'
    obsm: 'spatial', 'X_pca', 'X_umap'
    varm: 'PCs'
    obsp: 'distances', 'connectivities'
[26]:
# Plot the clusters
st.pl.cluster_plot(adata_concat, use_label="leiden", crop=False, size=1.4, cell_alpha=1, bbox_to_anchor=(1.2, 1))
[26]:
AnnData object with n_obs × n_vars = 7785 × 3018
    obs: 'in_tissue', 'array_row', 'array_col', 'imagecol', 'imagerow', 'batch', 'leiden'
    var: 'n_cells', 'highly_variable', 'means', 'dispersions', 'dispersions_norm', 'mean', 'std'
    uns: 'spatial', 'log1p', 'hvg', 'pca', 'neighbors', 'umap', 'leiden', 'batch_colors', 'leiden_colors'
    obsm: 'spatial', 'X_pca', 'X_umap'
    varm: 'PCs'
    obsp: 'distances', 'connectivities'